
The Real Price of “Just in Case” Stock: Why Carrying Cost Is 26%, Not 12%
“It’s only five extra days of stock”
It is a conversation I have heard in more than one monthly review.
- Plant head: “Let’s hold five extra days of stock. We can’t afford another line stoppage this quarter.”
- Finance head: “That’s a lot of money sitting in the stores.”
- Planner: “It’s only the interest. About 12% a year.”
That last line is where most of the cost goes missing. Interest is only one part of what it costs to hold stock, and usually less than half of it.
What holding stock really costs
Every rupee of inventory carries costs well beyond the interest on the money tied up in it. A typical build-up for a manufacturing plant looks like this:
| Cost element | Typical share of stock value per year |
|---|---|
| Cost of capital | About 12% |
| Storage and handling | 6% |
| Obsolescence | 4% |
| Damage and shrinkage | 2% |
| Insurance and taxes | 2% |
| Total carrying cost | About 26% |
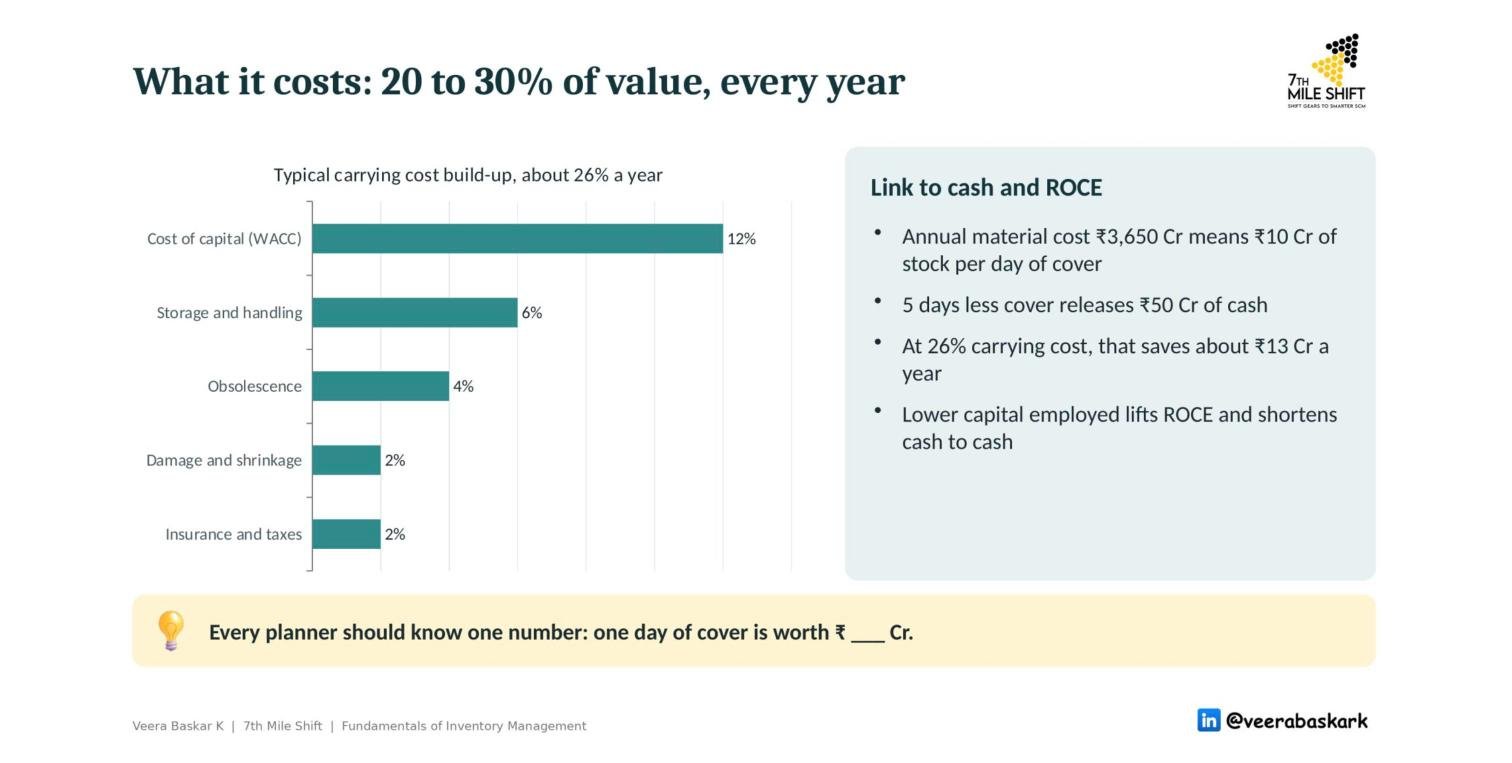
That is around 26% a year, for as long as the stock sits. Storage space, handling, material that goes out of date or gets damaged, and insurance all add up, and none of them appear when the discussion is framed as “only the interest”. Your own figures will differ, but most plants land somewhere between 20% and 30%.
What five extra days cost a real plant
Put the percentage against an actual number and the picture changes. Take a plant that uses ₹3,650 crore of material a year:
- One day of cover holds ₹10 crore of stock (₹3,650 crore ÷ 365 days).
- Five extra days lock up ₹50 crore.
- At 26%, carrying that stock costs about ₹13 crore a year.
The same arithmetic works in reverse. Taking five days of cover out releases ₹50 crore of cash and saves around ₹13 crore a year. Lower capital employed also lifts return on capital employed (ROCE) and shortens the cash-to-cash cycle.
Ask a better question: which parts actually need extra days?
Once the cost is on the table, the discussion usually changes. The question moves from “how many extra days?” to “which parts actually need them?”, and that is a far better question.
A blanket buffer across every part is the most expensive way to protect the line. Most of the risk sits in a small number of parts: those with long or unreliable lead times, a single source, or no quick substitute. Those parts deserve generous safety stock. The rest can run leaner. Our guide to ABC-VED analysis for critical parts shows a simple way to find them.
Every planner should know one number
Every planner should know what one day of cover is worth in their own plant. Working it out takes a few minutes:
- Take your annual material consumption value from the ERP or the cost sheet.
- Divide it by 365. That is the value of one day of cover.
- Multiply by your carrying cost rate (start with 26% if you have no figure of your own) to see what each extra day costs per year.
With that number in hand, every request for “a few more days, just in case” becomes a decision with a price attached, rather than a feeling.
Frequently asked questions
What is inventory carrying cost?
It is the total annual cost of holding stock, expressed as a percentage of its value. It includes the cost of capital, storage and handling, obsolescence, damage and shrinkage, and insurance and taxes.
Why is carrying cost higher than the interest rate?
Interest covers only the cost of the money tied up. Holding stock also uses warehouse space and labour, and exposes material to obsolescence, damage and loss. Together these typically add as much again as the interest.
How can a plant reduce carrying cost without risking line stoppages?
Set buffers part by part instead of across the board. Hold more stock of critical, long-lead or single-source parts, and less of everything else. Review the norms regularly against actual consumption and supplier performance.
Who in your plant owns the carrying-cost number?
In many plants, nobody does. Finance knows the cost of capital, stores knows the space, and planning knows the days of cover, but no one puts them together. Making one person own that number is often the first step to freeing up cash.
At 7th Mile Shift, we help mid-sized manufacturers set inventory norms that protect the line without locking up cash. See our inventory management services, read our case studies, or get in touch to work out what one day of cover is worth in your plant.
One Reply to “The Real Price of “Just in Case” Stock: Why Carrying Cost Is 26%, Not 12%”
ABC-VED Analysis: Why a ₹200 Part Can Stop Your Line | 7th Mile Shift
18 Nov 2026[…] buffers are not free. See the real price of “just in case” stock to work out what one day of cover costs in your […]
Comments are closed.